 Blog
BlogA liquidation heatmap marks the price zones where leveraged positions are set to be force-closed. The brighter the band, the more estimated volume sits there — and the harder it pulls price. Below are predictive maps for 50 coins on Binance futures.
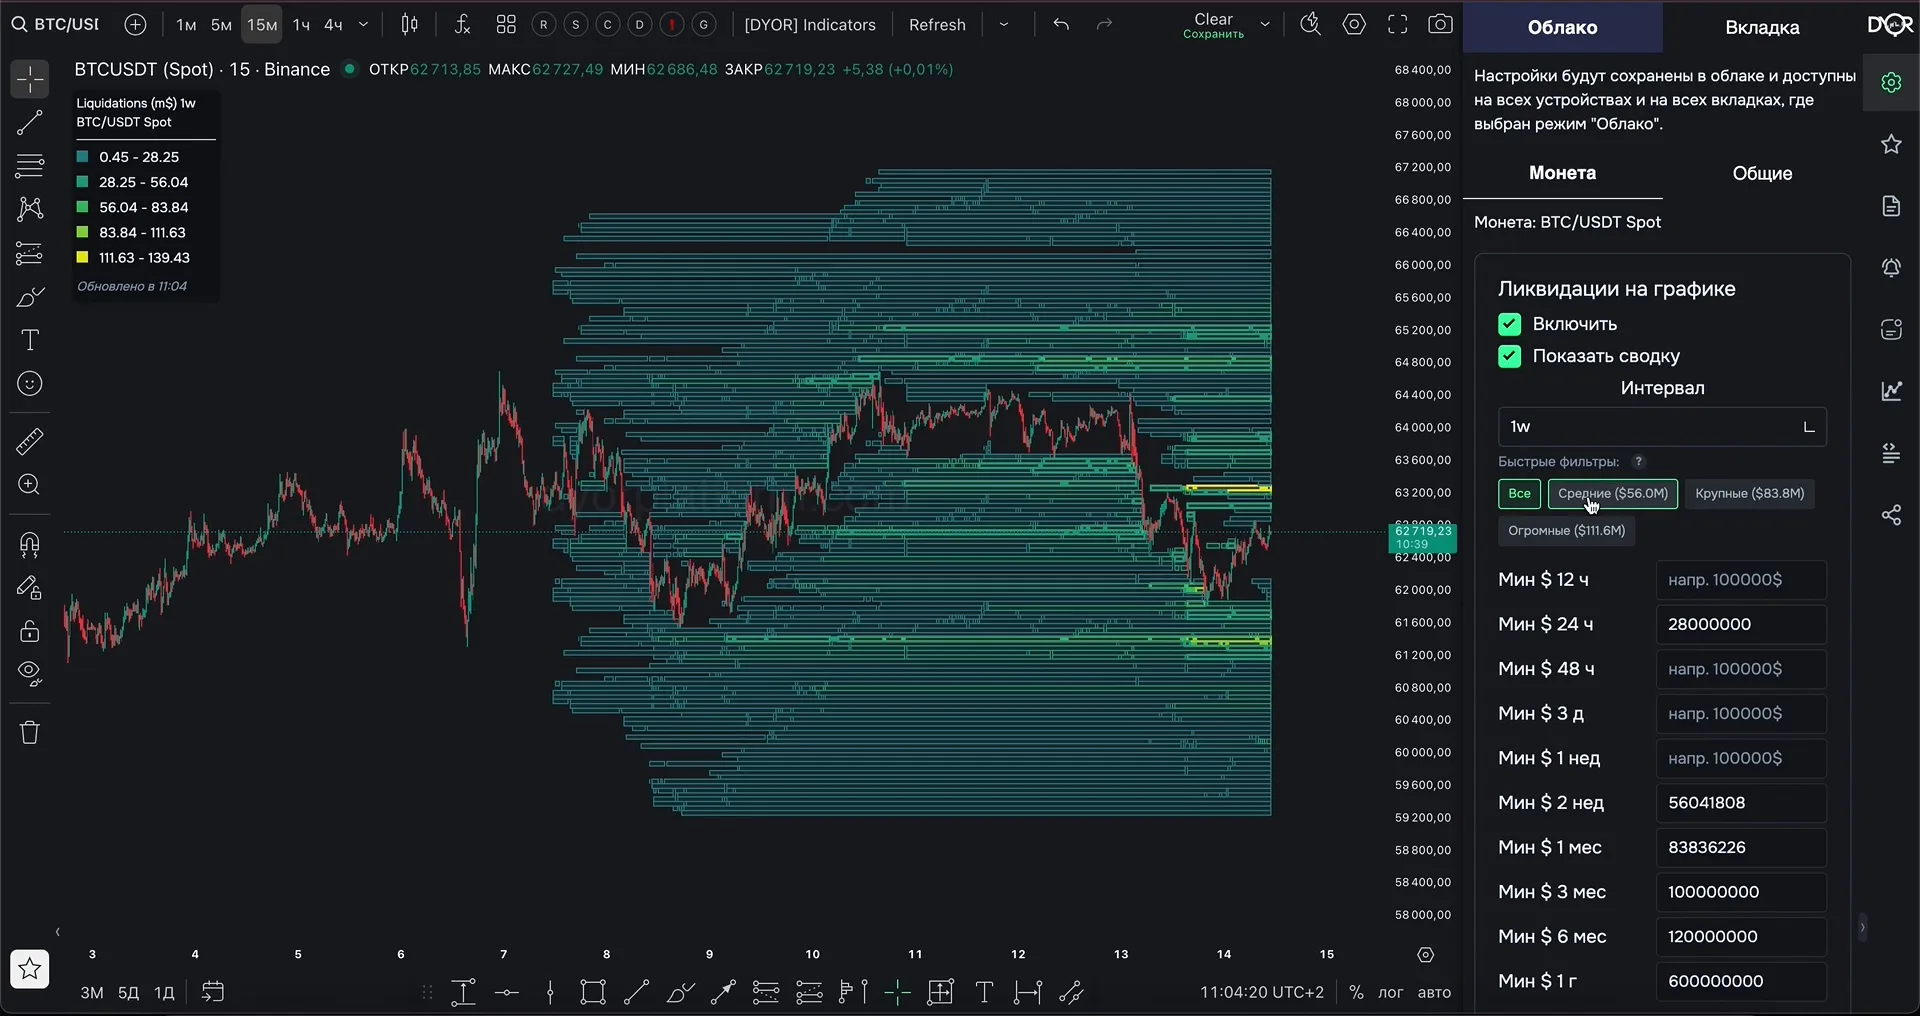
Leverage decides the distance. A 10x long is force-closed roughly 9–10% below its entry, 25x around 4%, 50x around 2%. Traders pile into the same price areas, so those distances stack up into dense bands above and below the market. The heatmap shades every band by estimated volume: bright means a lot of leverage waiting to be closed, dim means noise you can ignore.
A forced closure is a market order nobody chose to send. Once price reaches a dense band, each liquidation pushes it deeper in, which triggers the next one. That is a cascade, and it is why price so often runs into a bright zone, empties it and turns around. A predictive map shows the fuel before it burns; a historical chart only confirms it afterwards.
It is a map of the price zones where leveraged positions on Binance futures are likely to be force-closed. Each zone carries an estimated liquidation volume, so you can tell which levels actually matter and which are noise.
A liquidations chart plots what has already been closed, bar by bar, after the fact. A heatmap plots where the remaining leverage still sits, so it points forward instead of backward.
Predictive. It estimates where liquidations are going to happen from current positioning, instead of drawing where they already happened. Accumulation ranges go from 12 hours up to 1 year.
Fifty coins have their own map below, from BTC and ETH down to meme and DeFi tickers. Data comes from Binance spot and futures, with 900+ pairs available in the workspace.
Starting is free: live chart and watchlist stay free forever, and the heatmap with 40+ indicators is open for a 14-day trial.
The full predictive map with estimated volume per zone, noise filtering and Telegram alerts is in the DYOR workspace. Free to start.
Open DYOR Platform