 Liquidation heatmapsBlog
Predictive map of Bitcoin liquidation zones on Binance futures
Snapshot taken: 2026-10-08 01:41 UTC
These are DYOR's own numbers, collected from the Binance futures liquidation stream rather than bought from an aggregator. Long liquidations are positions forced to sell, short liquidations are positions forced to buy — the side with the bigger figure is the one that got hurt. Open interest tells you whether leverage is building up or leaving, and the share of accounts sitting long shows which way the crowd is leaning on BTC.
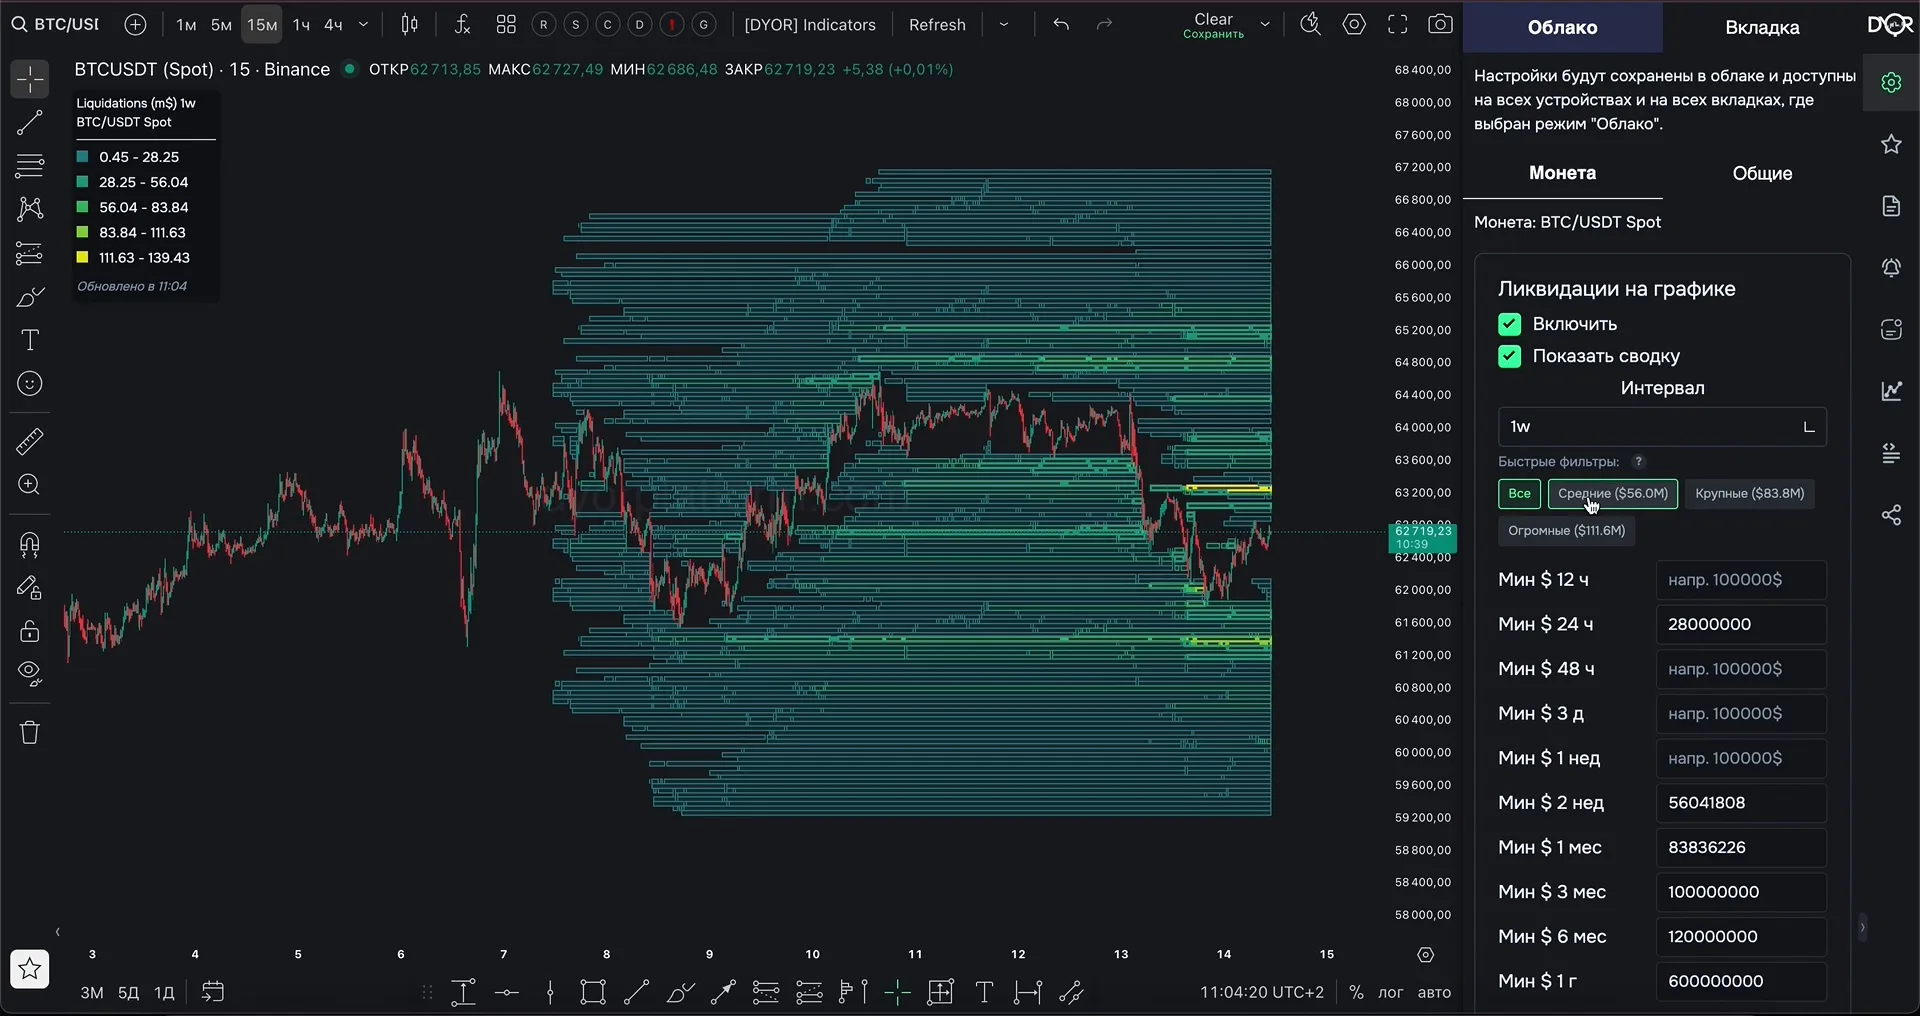
Every leveraged BTC position has a liquidation price. Positions opened near the same level with the same leverage get liquidated in the same zone: 10x longs sit roughly 9–10% below their entry, 25x about 4%, 50x about 2%. When many traders enter around one price, those distances stack into dense liquidation zones above and below the current BTC price. The heatmap shades each zone by estimated BTC volume, so the brightest bands mark where the most leverage — and the most fuel for a move — is concentrated.
A liquidation is a forced market order. When BTC reaches a dense zone, liquidations fire one after another, each pushing price deeper into the cluster. That is how cascades start, and why price so often sweeps a liquidation pocket before reversing. A predictive heatmap shows those pockets before they burn, not after.
Bitcoin runs the deepest derivatives market in crypto, so its liquidation map is usually the most reliable to trade. Order books are thick and funding is liquid, which means a dense BTC zone rarely gets swept by accident — when a major cluster breaks it is normally a real move, not a thin-book wick.
Because so much leverage sits on BTC, its liquidation levels also work as a reference for the whole market: alts often cascade in sympathy when a big BTC zone is taken out. Watching where BTC liquidity is stacked is a fast read on overall risk.
It is a map of price zones where leveraged Bitcoin positions on Binance futures are likely to be force-closed. Each zone shows an estimated liquidation volume, so you can see which levels matter and which are noise.
Predictive. It estimates where liquidations will happen based on current positioning, instead of drawing where they already happened. Ranges go from 12 hours up to 1 year of accumulated zones.
The DYOR workspace is free to start: live chart and watchlist forever, a 14-day full trial for the heatmap and 40+ indicators.
Binance spot and futures, BTCUSDT and 900+ other pairs.
The full predictive map with estimated volume per zone, noise filtering and Telegram alerts is in the DYOR workspace. Free to start.
Open DYOR Platform